- Introduction
- A. Finding the Number of Solutions with Desmos
- B. Using Desmos to Solve Quadratic Equations
- C. Restricting Polynomial Equations with Desmos
- D. Trigonometric Functions
- E. Solving Absolute Value Functions
- F. Composite Functions with Desmos
- G. Functional Values
- H. Finding the Radius of a Circle
- I. Solving Mean and Median Problems with Desmos
- J. Solving Word Problems with Desmos
- FAQs : Frequently Asked Questions
Introduction
Digital SAT preparation can feel like an uphill battle, especially when you’re faced with complex math problems that seem to require more time than you have. But what if there was a tool that could make these problems easier to understand and faster to solve? Enter Desmos – an advanced graphing calculator that’s not only permitted during the SAT but can also become your best ally in boosting your score.
Desmos isn’t just any calculator. It’s a dynamic, interactive tool that allows you to visualize math problems in ways that traditional methods often can’t. Whether you’re working with linear equations, polynomial functions, or trigonometric identities, Desmos brings the problems to life, helping you see solutions that might otherwise be hidden. Its intuitive interface and powerful graphing capabilities can simplify even the most challenging SAT questions, saving your precious time and reducing the likelihood of errors.
In this blog, we’ll learn how Desmos can transform your SAT preparation. You’ll learn how to utilize Desmos for a variety of math problems that commonly appear on the test.
A. Finding the Number of Solutions with Desmos
Understanding systems of linear equations is a crucial part of the SAT. Let’s explore how to determine the number of solutions to a system using Desmos:
Given System of Equations:
![]()
![]()
We need to find out how many solutions this system has.
Step 1: Input the Equations in Desmos
To start, enter both equations into Desmos:
![]()
![]()
These are the rearranged versions of the given equations for graphing purposes.
Step 2: Analyze the Graph
When you plot both lines on the graph, you’ll see that they intersect at a single point. It shows that the system has exactly one solution ![]() .
.
B. Using Desmos to Solve Quadratic Equations
Quadratic equations are a staple of the SAT math section, and finding their roots (or solutions) can sometimes be tricky. Luckily, Desmos can simplify this process, allowing you to visually identify the roots and confirm your answers quickly.
A. Given Equation:
![]()
Now we first need to set the equation equal to zero to find it’s roots. Rearranging the terms:
![]()
Now, let’s input this quadratic equation into Desmos.
Step 1: Graph the Equation
Open Desmos. After rearranging it from ![]() to
to ![]() , input the equation
, input the equation ![]() . You’ll see a parabola.
. You’ll see a parabola.
Step 2: Identify the Roots
The x-coordinates, where the parabola intersects the x-axis, are the roots of the equation. In Desmos, these points of intersection will be automatically highlighted, and you can hover over them to see the exact values.
In this case, the roots of the equation are the points ![]() and
and ![]() . The x-coordinates of these points represent the solutions to the equation
. The x-coordinates of these points represent the solutions to the equation ![]() .
.
B. Let’s use Desmos to solve the following equation and determine the possible value of ![]() :
:
![]()
Step 1: Enter the Equation
First, let’s enter the equation in the box:
![]()
Step 2: Finding the values of ![]()
After the execution analysis of this equation, you will get it’s curve. Now hover the cursor over the points where curve intersect the x-axis. These points (-5.5, 0) and (-4.5, 0) are the points where the rational function equals 4 i.e. values of x for which the given equation is satisfied.
Step 3: Finding the possible values of ![]()
In the next box, substitute the values of x which are -5.5 and -4.5 one by one after entering the expression ![]() and then check the possible values in the options. In this case it is -4.5.
and then check the possible values in the options. In this case it is -4.5.
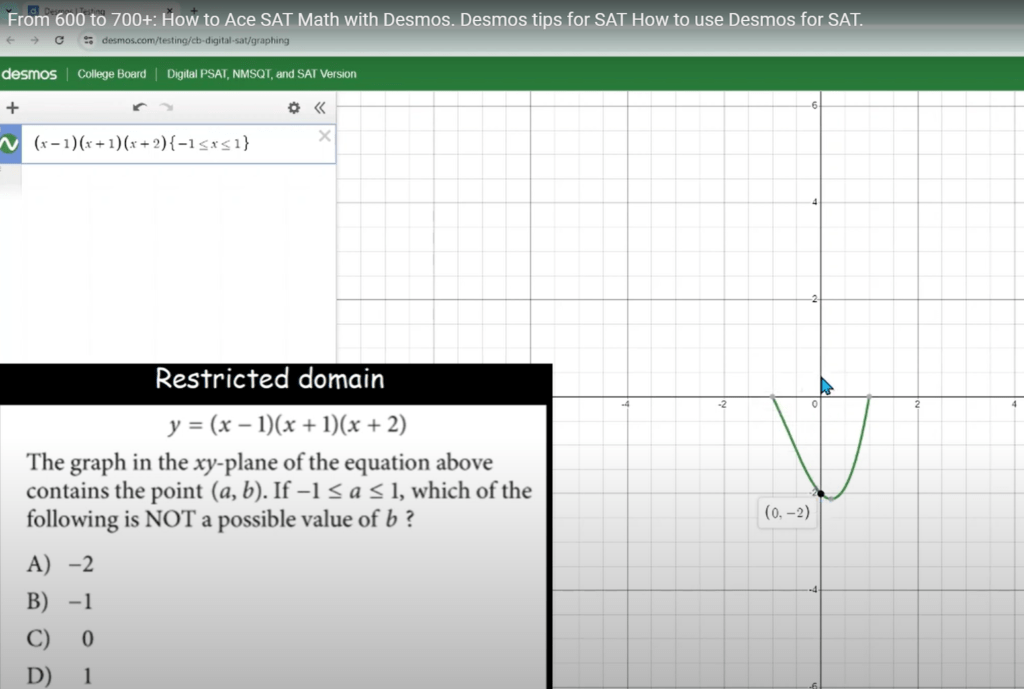
C. Restricting Polynomial Equations with Desmos
Q. Given the function ![]() , the graph of this equation passes through the point
, the graph of this equation passes through the point ![]() where
where ![]() . Which of the following is not a possible value of
. Which of the following is not a possible value of ![]() ?
?
A) -2
B) -1
C) 0
D) 1
Solution: ![]()
We’ll explore how to use Desmos to determine which values of ![]() are possible when
are possible when ![]() .
.
Step 1: Enter the Function in Desmos
Start by opening Desmos and inputting the function:
![]()
Desmos will automatically graph the function, allowing you to visualize its behavior.
Step 2: Restrict the Domain
The problem specifies that ![]() is between -1 and 1, inclusive. In Desmos, you can restrict the domain of the function to focus on this interval. Modify the equation to:
is between -1 and 1, inclusive. In Desmos, you can restrict the domain of the function to focus on this interval. Modify the equation to:
![]() for
for ![]()
This will highlight the portion of the graph within the specified range.
Step 3: Looking for the Possible Values of ![]()
Now, examine the graph within this restricted domain. The y-values on this segment of the graph represent the possible values of ![]() .
.
By moving along the graph between ![]() and
and ![]() , Desmos will display the corresponding
, Desmos will display the corresponding ![]() -values. Identify the range of
-values. Identify the range of ![]() in this interval to determine which values are and are not possible.
in this interval to determine which values are and are not possible.
For example, if you observe that the y-values range from a minimum of -2 to a maximum of 4, any value outside this range would not be a possible value for ![]() .
.
D. Trigonometric Functions
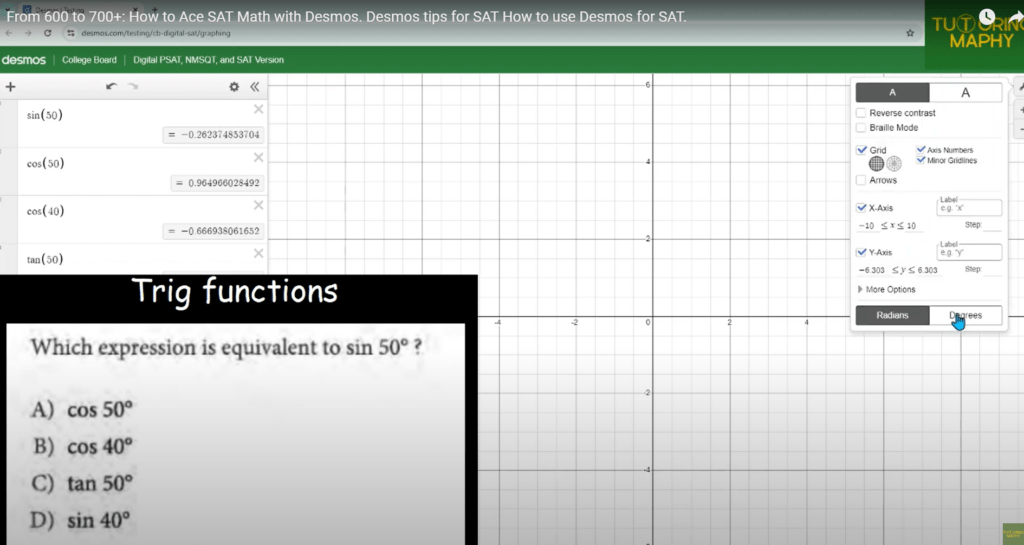
Q. Which expression is equivalent to ![]() ?
?
- A)

- B)

- C)

- D)

Solution:
Step 1: Input the Trigonometric Functions
In Desmos, enter the following trigonometric expressions separately:
But you will be puzzled after seeing that none of the options is matching with yours but why? The answer is that you would have probably put the angles in degrees instead of radians which is by default in Desmos. To convert, click on the ‘Graph Settings’ icon at the top right corner and then choose the degrees instead of radians at the bottom.
Step 2: Compare the Values
Desmos allows you to see the numerical values of these trigonometric expressions. Compare them to find the equivalent expression to ![]() .
.
You’ll notice that ![]() and
and ![]() yield the same value.
yield the same value.
How Desmos Calculated:
![]()
This is due to the co-function identity in trigonometry, which states that ![]() .
.
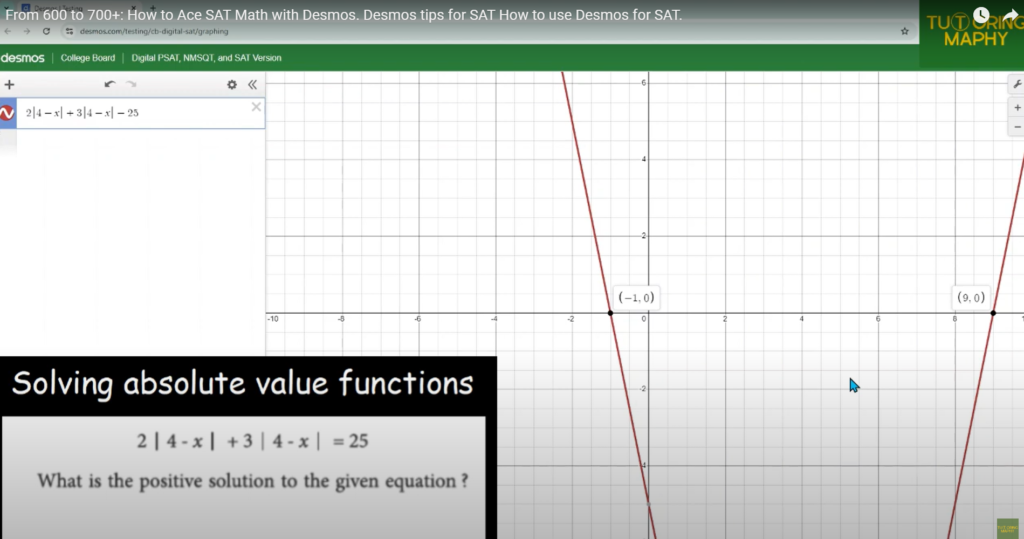
E. Solving Absolute Value Functions
Given Equation:
![]()
We need to find the positive solution to this equation.
Step 1: Input the Equation in Desmos
Start by entering the given equation into Desmos:
![]()
Desmos will graph the function, and you can visually analyze where the equation holds true.
Step 2: Identify the Positive Solution
The graph will show the points where the equation equals 25. These intersection points represent the solutions. To find the positive solution, focus on the x-value where the graph intersects 25 and is positive.

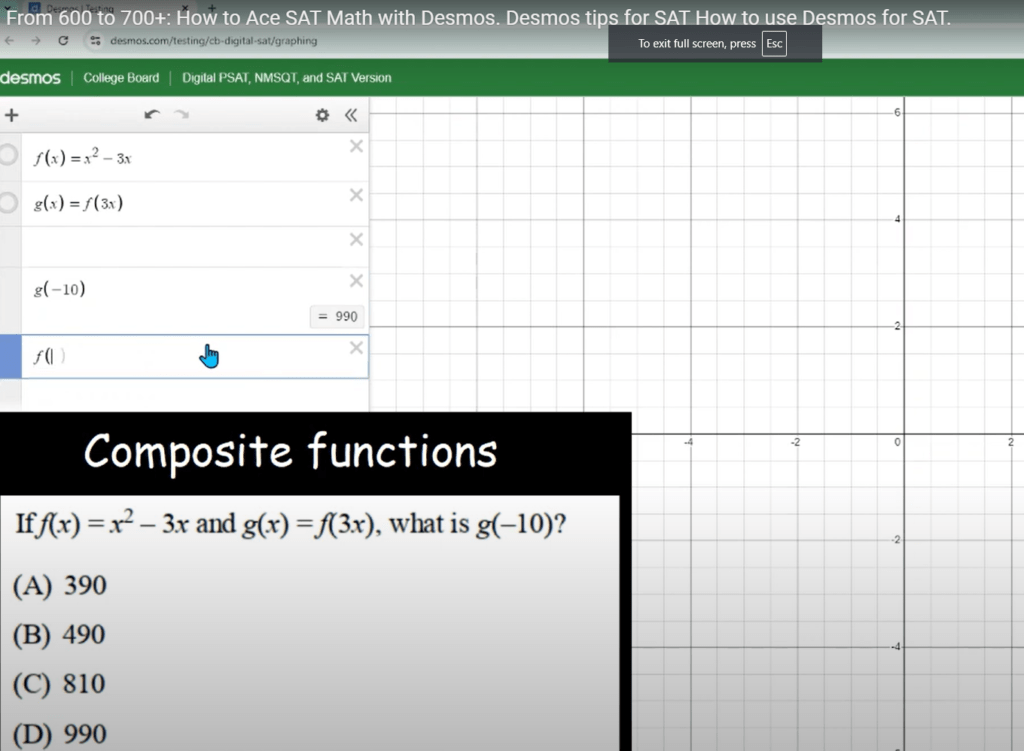
F. Composite Functions with Desmos
Composite functions often appear in SAT questions and can sometimes be tricky to solve manually. Desmos can make this process a lot more intuitive by allowing you to visualize and calculate composite functions step by step. Let’s look at how to solve a typical composite function problem using Desmos.
Given Functions:
![]()
![]()
The question asks for the value of ![]() . Let’s break it down and solve it using Desmos.
. Let’s break it down and solve it using Desmos.
Step 1: Put the function
Desmos is smart enough to recognize and analyze the functions so just put the function ![]() in the box and similarly fill the next box with the relation between
in the box and similarly fill the next box with the relation between ![]() and g(x) that is
and g(x) that is ![]() . Then it will automatically fetch the function
. Then it will automatically fetch the function ![]() as follows:
as follows:
![]()
Step 2: Calculate ![]()
Now, just type what you want it to calculate i.e. ![]() and it will calculate
and it will calculate
![]()
G. Functional Values
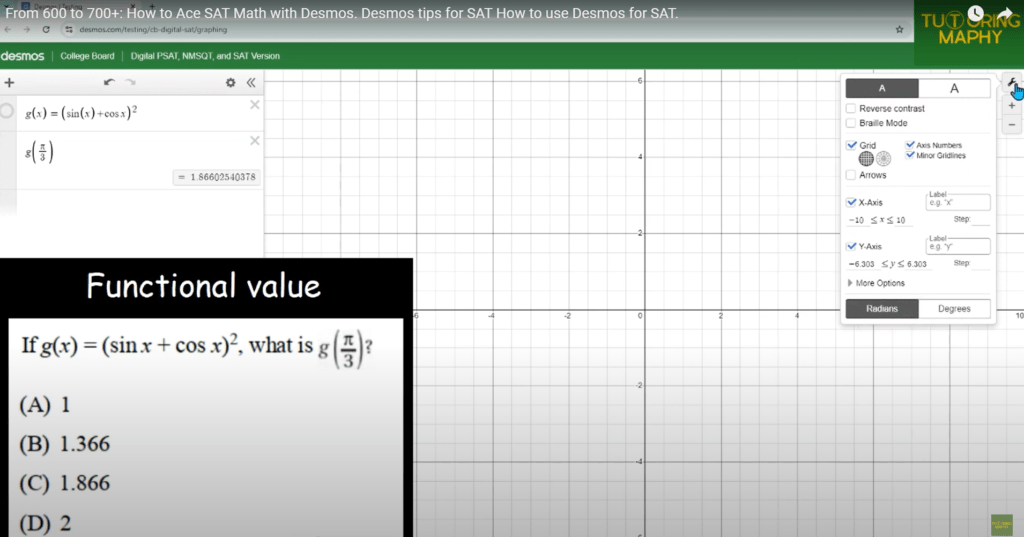
Let’s solve the following functional value problem using Desmos:
Problem:
If ![]() , what is
, what is ![]() ?
?
Step 1: Input the Function into Desmos
To start, open Desmos and input the function ![]() .
.
Step 2: Evaluate the Function at ![]()
Next, evaluate the function at ![]() . In Desmos, you can do this by directly substituting
. In Desmos, you can do this by directly substituting ![]() .
.
- In the same expression box, enter
 .
. - Desmos will instantly compute the value and display the result.
How Desmos Calculated:
1. Enter the expression ![]() .
.
2. Desmos will automatically calculate the value, which should be approximately 1.866.
Step 3: Verify the Solution
Desmos also allows you to check intermediate steps. For example, you can verify that:
![]() and
and ![]() .
.
The sum ![]() gives
gives ![]() , which Desmos will compute for you.
, which Desmos will compute for you.
Finally, squaring this result yields the final value of ![]() .
.
Step 4: Analyze the Result
Desmos not only provides the numerical result but also allows you to see how the function behaves visually. This helps you understand the function’s behavior and verify the correctness of your solution.
H. Finding the Radius of a Circle
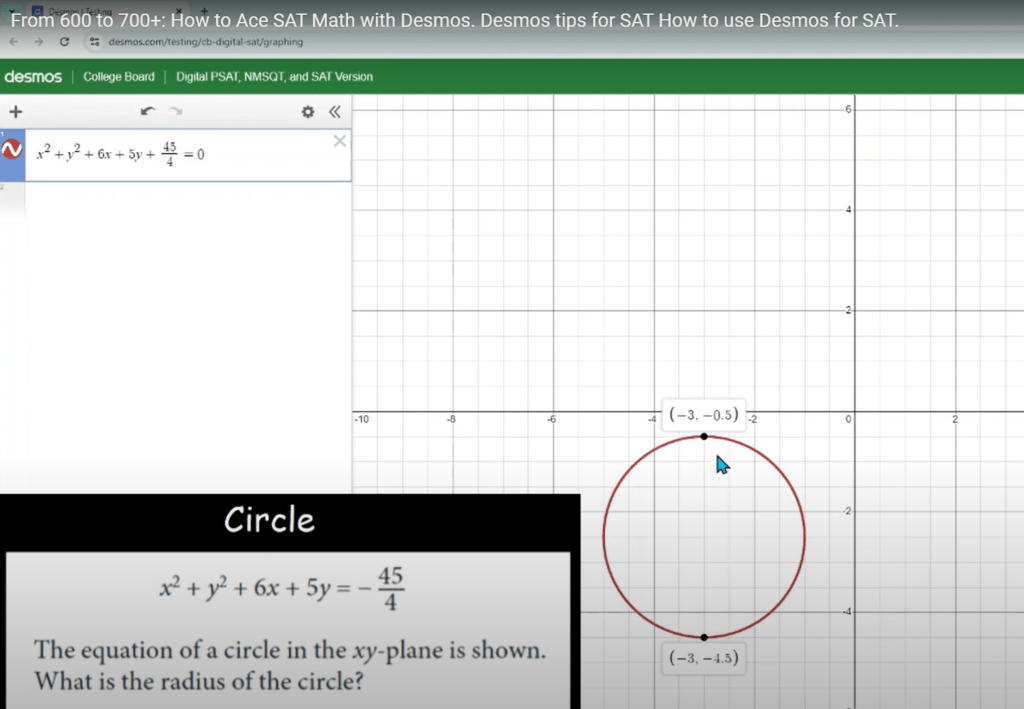
In this problem, we are given the equation of a circle and asked to find its radius. Desmos can help us solve this problem effectively by allowing us to manipulate the equation and calculate the radius directly.
Problem:
The equation of a circle in the ![]() -plane is given by:
-plane is given by:
![]()
What is the radius of the circle?
Solution:
Step 1: Input the Equation into Desmos
1. Open Desmos and enter the following:
![]()
Desmos will plot the circle based on this expression.
Step 2: Calculate the Radius Using Desmos
Now since Desmos has displayed the circle, you can see the center and radius directly on the graph.
You can hover the cursor on topmost point of it’s periphery, it will show ![]() and at the bottom most point, it will show
and at the bottom most point, it will show ![]() , so you can manually calculate the radius that is
, so you can manually calculate the radius that is
![]()
I. Solving Mean and Median Problems with Desmos
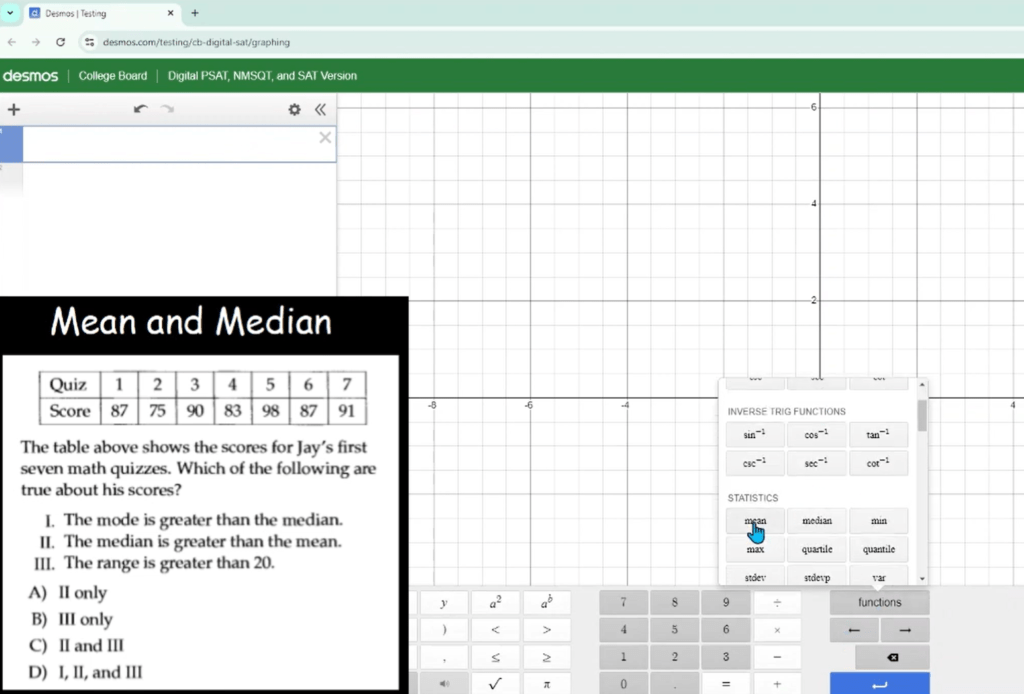
Q. The table below shows the scores for Jay’s first seven math quizzes. Which of the following are true about his scores?
| Quiz | 1 | 2 | 3 | 4 | 5 | 6 | 7 |
|---|---|---|---|---|---|---|---|
| Score | 87 | 75 | 90 | 83 | 98 | 87 | 91 |
I. The mode is greater than the median.
II. The median is greater than the mean.
III. The range is greater than 20.
A) II only
B) III only
C) II and III
D) I, II, and III
Solution : In this problem, you’re given Jay’s scores from seven math quizzes and asked to determine the accuracy of three statements about his scores. Desmos can be a powerful tool to solve these statements.
Step 1: Calculate the Mean
Start by entering the scores after selecting mean function in the virtual keyboard of Desmos. Input the data as follows:
mean(87, 75, 90, 83, 98, 87, 91)
This allows you to calculate the mean easily that is approximately 87.29.
Step 2: Calculate the Median
In Desmos, you can calculate the median in a way similar to calculating the mean. Just select the median function this time in the virtual keyboard and input the data as follows:
median(87, 75, 90, 83, 98, 87, 91)
and then it will output the median as 87
Step 6: Analyze the Statements
Now that you have all the necessary information, let’s evaluate the statements:
1. The mode is greater than the median.
false.
2. The median is greater than the mean.
false.
3. The range is greater than 20.
The only statement left is this one hence you can easily mark the B) option as a correct one without even calculating for it.
J. Solving Word Problems with Desmos
Q. When a buffet restaurant charges 12 dollar per meal, the number of meals it sells per day is 400. For each 0.50 dollar increase to the price per meal, the number of meals sold per day decreases by 10. What is the price per meal that results in the greatest sales, in dollars, from meals each day.
- A. 16
- B. 20
- C. 24
- D. 28
Solution : Word problems can often feel intimidating, but with Desmos, you can transform them into a more approachable and solvable challenge. In this particular problem, we’re tasked with finding the price per meal that results in the greatest sales. Desmos makes this process more intuitive.
1. Set Up the Revenue Function: Start by defining the revenue function, ![]() . Here, the price is
. Here, the price is ![]() , and the quantity sold is
, and the quantity sold is ![]() , where
, where ![]() represents the number of
represents the number of ![]() increases in the price.
increases in the price.
2. Input the Function into Desmos: Enter the function ![]() into Desmos. This will give you a clear visual representation of the revenue as a function of price increases.
into Desmos. This will give you a clear visual representation of the revenue as a function of price increases.
3. Find the Maximum Point: Using Desmos’ maximum feature, you can quickly identify the peak of the curve, which will correspond to the price per meal that results in the greatest sales. This point provides the answer to the problem.
Desmos not only simplifies the math but also gives you confidence in solving word problems efficiently.
FAQs : Frequently Asked Questions
Q. Can You Use Desmos on the SAT?
Yes, Desmos is available on the digital SAT. It’s built into the test interface, so bringing your own calculator is optional. Familiarize yourself with Desmos before the test to maximize efficiency and accuracy.
Q. How to Use Desmos on the Digital SAT?
To use Desmos on the digital SAT, simply click the calculator icon during the math section. Desmos can handle basic calculations, graph functions, and solve equations. Practice with Desmos in advance so you can quickly and confidently use it during the exam. Knowing its capabilities can save time and help you tackle complex problems.
Q. How to Increase SAT Score?
- Understand the Test: Familiarize yourself with the SAT structure, question types, and time limits.
- Target Weak Areas: Identify and focus on improving specific topics where you struggle.
- Practice Regularly: Use practice tests to simulate the test environment, review and learn from mistakes, and track progress daily.
- Utilize Online Tools: Leverage resources like TutoringMaphy, Khan Academy for targeted practice and Desmos for math problem-solving.
- Develop Test Strategies: Work on pacing, answer elimination, and smart guessing to maximize your score.
- Maintain a Routine: Stick to a consistent study schedule and ensure you’re well-rested before test day.


